Greetings on the second equinox of 2020. Today the Earth is in perfect balance relative to the sun, and everyone everywhere gets 12 hours between sunrise and sunset. For those of you who are new to these letters, welcome. I publish them on the equinoxes and solstices as the cycle from one to the other will stay consistent, even though familiar seasons they herald are shifting—one of the many patterns that will break down as our climate changes.
I have worked with a wide variety of data for three decades, searching census records, national accounts, business and individual surveys, trade statistics, national archives, global demographic sources, and others for patterns to understand and explain how and why communities, cities, countries, companies, and industries came to have good or bad outcomes and to foresee what their futures might hold. When I began working in finance, I was struck by how little history was incorporated in most research. Often the last 10 years were considered representative. Almost never did analysis draw on times before the end of WWII. When I asked, researchers would tell me that the times before were too volatile, too dissimilar, or had too few records to include in their analysis. In this age of exponentially accelerating information, we have more data about last week than we do about all of life before 1945, so the recent data gets mined extensively. “Big data” is almost always “recent data.” This would be fine if the recent past offered valuable insight, but there is a massive problem with relying on recent data to prepare for the future, especially in the United States: for many decades leading up to now, nothing much happened.
Some readers of this letter are reflexively opposed to the idea that nothing happened during their careers. The 2008-2009 Global Financial Crisis was global! And a crisis! It is the most common reference point for every potential economic outcome, including climate change. But in future history books the GFC is unlikely to warrant more than a page or two. In hindsight, charts of the stock market show 2009 to be yet another buying opportunity. Every setback in the last few decades has been a chance for the prosperous to, yet again, bet on more prosperity to come.
Last fall I spoke to an audience of trustees of endowments and foundations, the people charged with overseeing some of the largest funds in the United States. I asked them if their organizations had done any work on topics including civil violence in the United States, catastrophic natural disasters, a breakdown in global trade, nuclear explosions, or other disruptive events (at the last minute I omitted pandemics, figuring I would lose them). I wasn’t asking if their organizations thought of these things as the “base case” for their investments, but simply wanted to know if they had held a single meeting, tasked a single intern, or passed around a single article or book to consider the risks posed by these possibilities. None had. They couldn’t imagine those things happening. In the 1960s those would have all been active concerns, but since they hadn’t happened during the adulthood of my audience members, they were subjects of science fiction.
Being grounded in the recent past biases our analytical tools and limits our vocabulary and imaginations. This problem is both the subject of this letter and at the center of this endeavor we call Probable Futures. If, as is common in the business world, you want me to get to the “bottom line,” the message is simple: the recent past is perhaps the worst possible preparation for what is to come. The mindsets, skills, and models that led to success in the last 75 years are likely to lead to disastrous ends as the climate changes.
Stability
Learning about climate and its relationship to prosperity exposed me to wonderfully long data series. Emperors, aristocrats, governors, and monks in Japan have recorded the peak blossoming of Kyoto cherry trees going back to at least the 800s. There were warmer years and cooler ones, but on average, over almost 1200 years, the peak was reached around April 15. In the last several years the average was around April 1. This year it was March 22. Shinto priests believe that when Lake Suwa completely freezes over the male god Takeminakata walks across the lake to visit the female god Yasakatome. According to records dating back to 1443, Takeminakata’s crossing date fell in a steady range for over 500 years; he must now wait roughly 5 extra weeks before his visit. In New England, where farming has never been easy, people have braved the elements several times a day to mark the weather. As a result, we know that the “growing season” between the last spring frost and the first winter frost is more than three weeks longer than it was for the first couple hundred years of records.
Probable Futures will show what cusps, edges, and limits will be crossed the further we get from the climate in which humans built civilization. We are confident that anyone who takes a bit of time to learn, looks around, and imagines how changes in the climate will affect life will understand their world better, experience more wonder, and appreciate the urgency and stakes of addressing climate change. They will also see what’s wrong with the models they have been offered or are themselves using.
We don’t see what doesn’t move
You might think that there should be no need to make people aware of the physical world we live in, given our long history of recording the weather and talking about it as a way to break the metaphorical ice. Yet many people’s lives are now so virtual—and almost completely indoors—that the physical world is increasingly abstract. Indeed, we refer to it as “outside.” This was not always so. In order to understand and anticipate the ways that climate change will affect civilization, I think it is essential to question how we got to the point where we think of nature as outside of where we live. The answer lies, it turns out, in the very stability of those cherry blossom records.
For roughly 12,000 years up until the last few decades, the Earth’s climate was almost perfectly stable. There were hotter years and colder ones, and in any given place there were “normal” years and ones during which records were set, but the range of temperature and rainfall was bounded, the pattern of seasons was the same as it ever was. We described our environment with what is known in English as the present simple tense in which the present tense implies permanent state: the Alps are covered in glaciers; Kyoto cherry trees blossom in April; India gets 70-90% of its rain during the monsoon season.
In general, I don’t think one needs to be comfortable with graphs to understand and appreciate climate change. Indeed, numbers with decimal points are often unhelpful to comprehending the issue. There is, however, one chart that I think everyone should know, namely the history of the average temperature on our planet. It is powerful, clear, and explains our existence. Here it is:

The graph is divided up into three sections. The left section shows the average temperature of the Earth as reconstructed from a variety of sources from 100 million years ago to 1 million years ago. The middle section is from 1 million years ago to 12,000 years ago, and the right section shows the time period from 12,000 years ago (10,000 BCE) to 2100. The vertical axis shows temperature in °C relative to the period from 1850 to 1900, today’s leaders’ formative years. You can see that tens of millions of years ago the Earth was much warmer than we are used to. Indeed, it likely would have been too hot for humans to survive, as our mammalian bodies generate heat and need to be cooled by our surroundings. Reptiles, amphibians, and the precursors to many birds were suited to this climate. Then, about 10 million years ago, the climate began cooling, gradually dipping into an ice age.
The middle panel shows this ice age. An ice age is a period when substantial portions of the continents are covered by glaciers. The regular pattern of cooling and warming from 0°C to -5°C and back are oscillations between glacial maxima—when ice covered most land—and warmer “interglacial” periods when glaciers receded to mountainous regions and areas nearer the Arctic and Antarctic Circles. These roughly 100,000-year cycles were triggered by changes in the Earth’s orbit and axis. Homo sapiens emerged during this time, around 200,000 years ago. Our ancestors were born into a world whose climate was constantly changing. It should be no surprise then, that they were mobile and often nomadic. A major factor of life must have been chasing the places where the weather was nice, as the nice places kept moving.
Which brings us to the last panel. Starting in about 10,000 BCE, the climate did something remarkable: it stabilized in an interglacial period. An ideal equilibrium was reached. The mix of the reflectiveness of the Earth’s surface (ice sends sunlight back into space) and the composition of the atmosphere (about 285ppm of CO2) was just right for homo sapiens. There were many nice places, and they stayed put.
Humans have now lived in stability for so long that we have terrible trouble imagining it ending. Perhaps even more problematic, however, is the way in which that stability has been woven into the tools experts use to investigate, explain, and advise, and storytellers help us know ourselves. The assessments you have undoubtedly read about what the future will be like are often worse than useless because they were built in a period of stability and cannot portray a world of instability.
Models
The DICE (Dynamic Integrated Climate Change) Model is a commonly used tool to assess the costs both of climate change and the possible actions that might mitigate it. Its author, William Nordhaus of Yale, won the Nobel Prize in Economics in 2018, partly for his work on productivity (his most famous paper is about the history of the cost of artificial lighting) and partly for his work on the economics of climate change. I have written an essay on the shortcomings of this work, which you can find via a link at the end of this letter, but a short description of the work should suffice here.
Nordhaus and his colleagues take account of the economic trends of the 20th century, assume that the economy is effectively a stable machine that produces economic output, and that it will do so indefinitely. Productivity growth continues into the future, with modest declines in the pace of innovation far in the future.
In short, the models portray a long future that is a continuation of the trajectory of the 20th century, with the messy parts smoothed out and very gradual climate change added in. This smoothness is fundamental to the models. In the 1990s Nordhaus offered this synopsis of scenarios with moderate climate change, dramatic climate change, and no climate change:
“Even though there are differences among the cases studied here, the overall economic growth projected over the coming years swamps the projected impacts of climate change or of the policies to offset climate change. In these scenarios, future generations are likely to be worse off as a result of climate change, but they are still likely to be much better off than current generations.”
This might be valuable insight, if either the climate models or the economic models he employs had the possibility of very bad things happening. Instead, human emissions are the only emissions in his climate models, and all of his economic scenarios offer a smooth, upwardly sloping arc of prosperity. Here is Nordhaus’s collaborator, Thomas Schelling’s description of this issue:
“The models of global warming project only gradual changes. Climates will ‘migrate’ slowly. The climate of Kansas may become like Oklahoma’s, but not like that of Oregon or Massachusetts. But a caveat is in order: the models probably cannot project discontinuities because nothing goes into them that will produce drastic change. There may be phenomena that could produce drastic changes, but they are not known with enough confidence to introduce into the models.”
I would rephrase this as: “Even though we know discontinuous things (e.g., enormous wildfires, civil unrest, collapse of the financial markets, general loss of trust, a breakdown of global trade) are possible, we haven’t observed them recently and thus don’t have a precise estimate of them. As a result, our analysis does not consider them at all.” The DICE model comes with default settings. Here are the outcomes they produce:
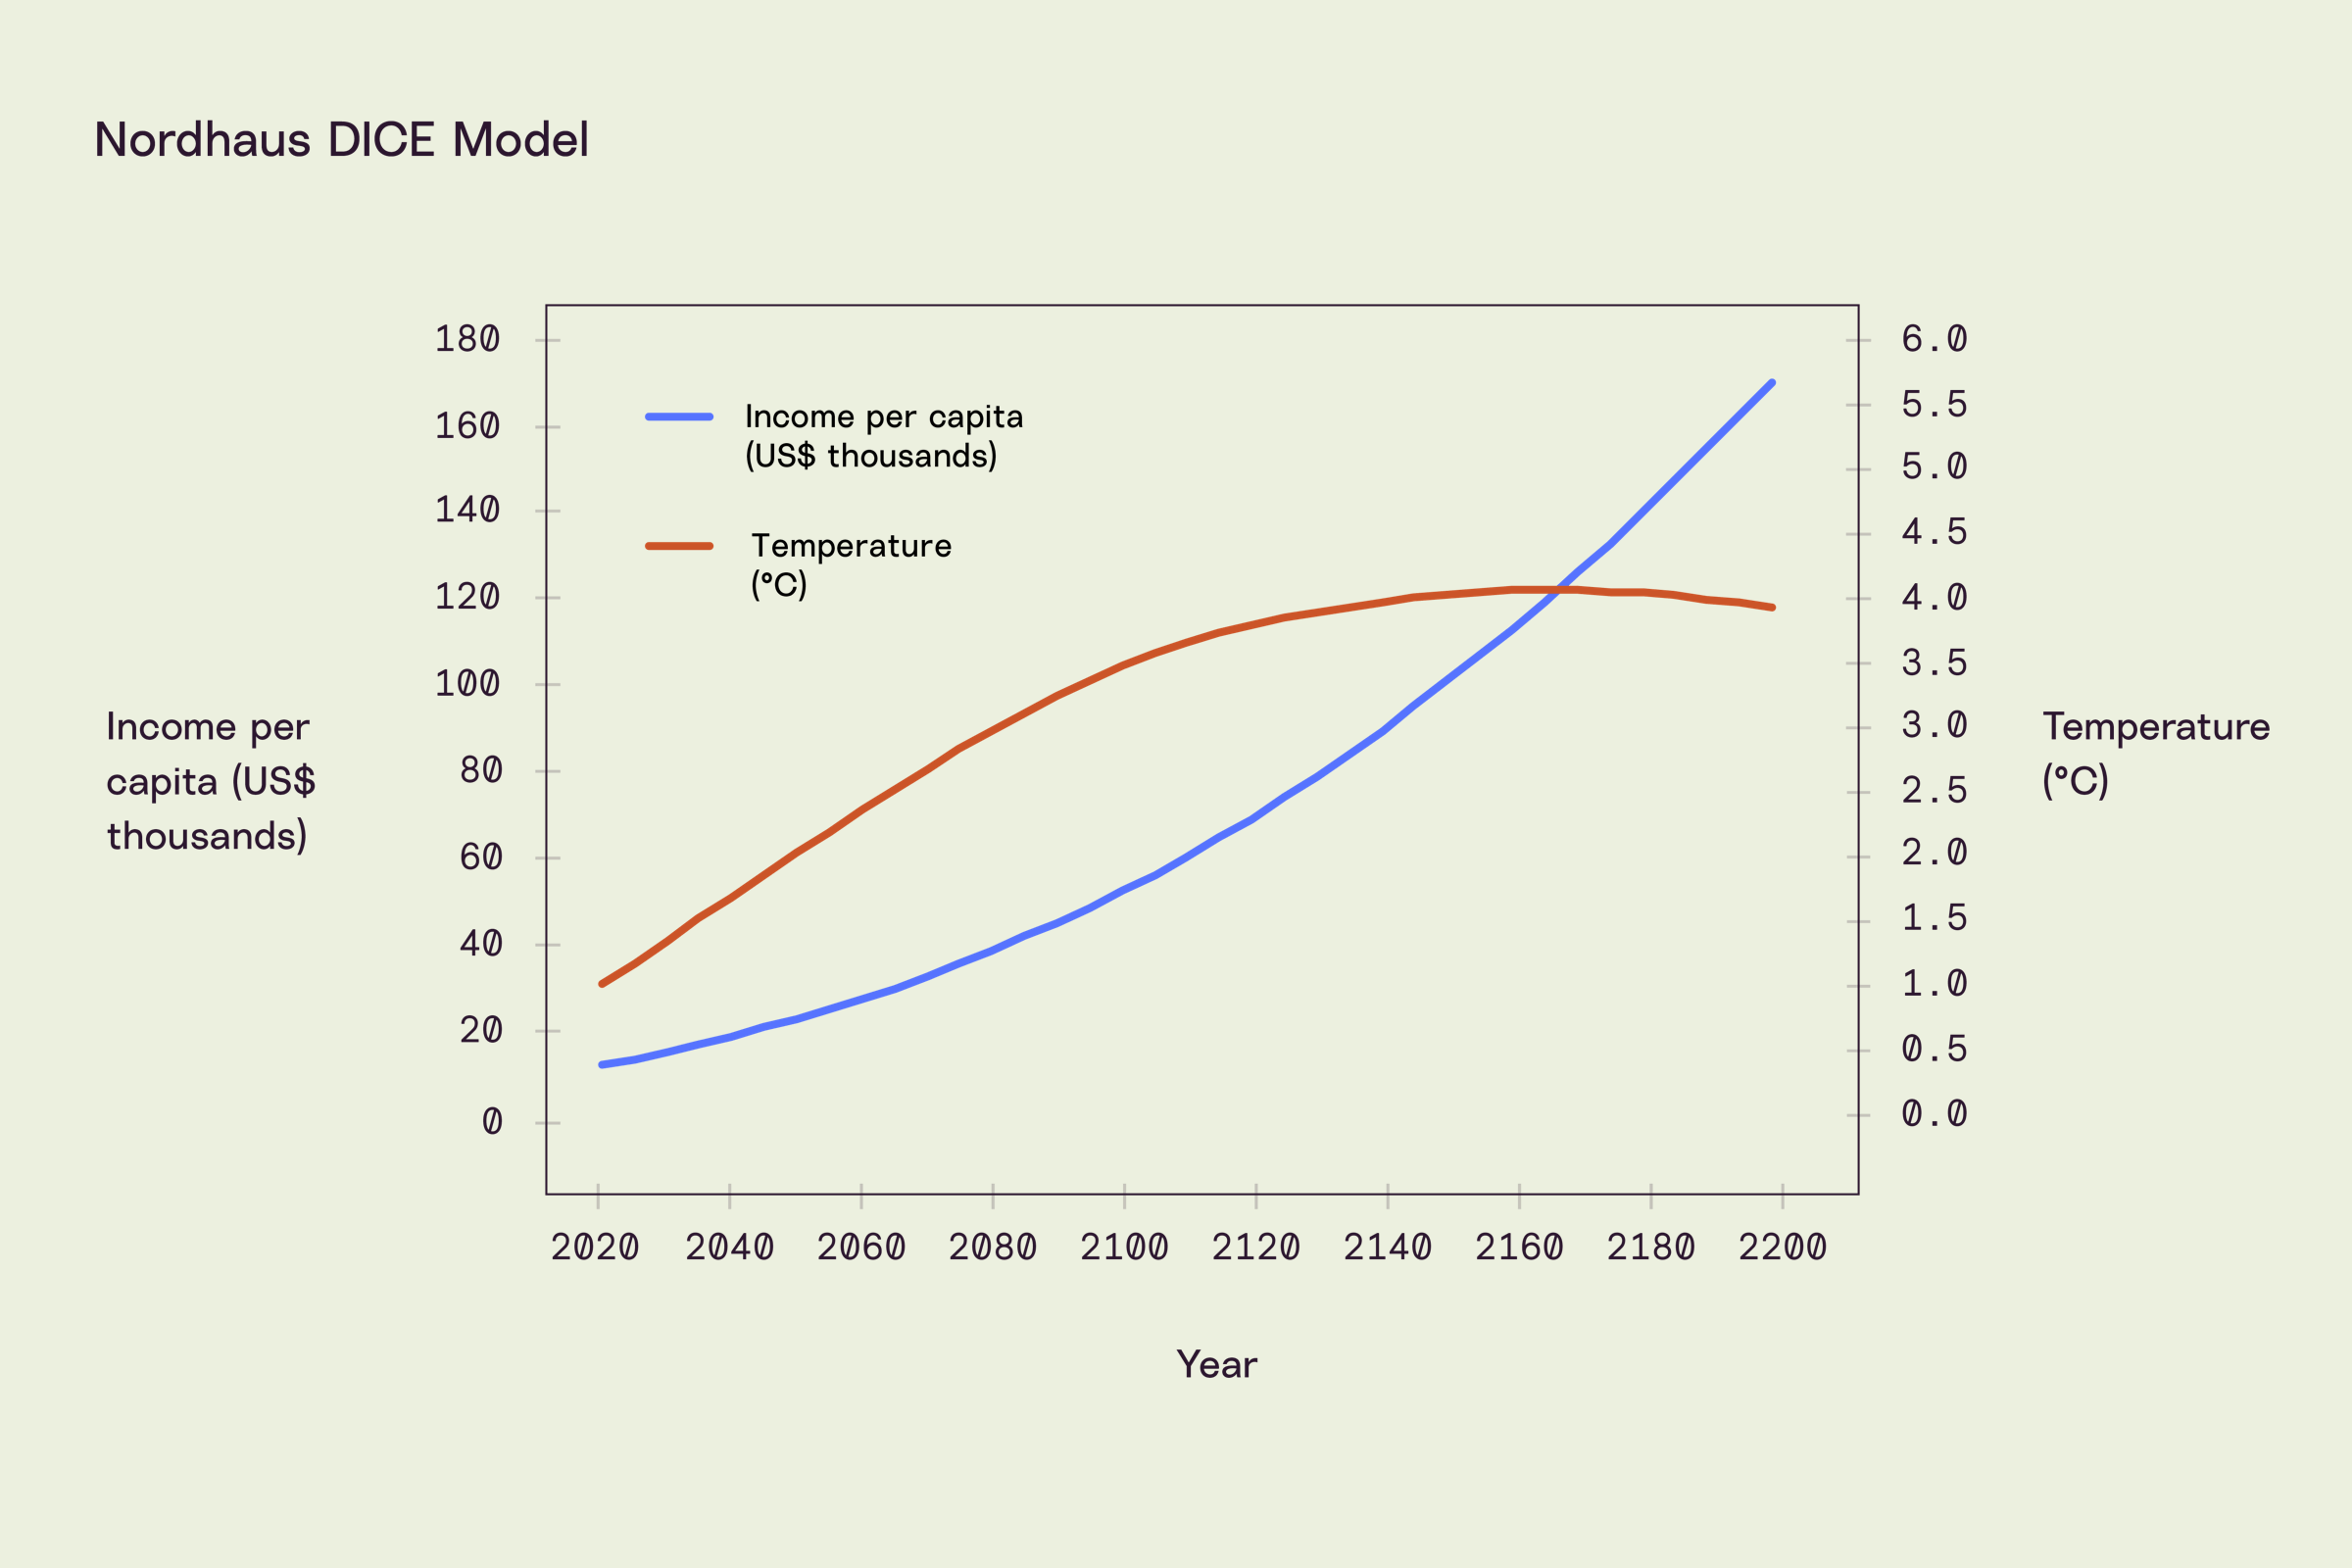
Per capita income rises unfailingly as the population reaches 11 billion people, so the global economy is vastly bigger than now, and temperatures climb over 3°C by the end of this century and top out around 4°C. In Nordhaus’s framework, everyone has so much of everything else that they don’t mind having a different climate.
Recently an organization called The Climate Impact Lab published work about mortality consequences of extreme heat. A link to a Bloomberg about the work is at the end of this letter. On their own the results are brutal, but I want to highlight a footnote here:
“The Climate Impact Lab research does not reflect the possibility of climate-related migration. As stated in their research, ‘existing empirical evidence of climate-induced migration, based on observable changes in climate to date, is mixed.’”
People haven’t recently moved in massive numbers due to climate change, although prehistoric evidence makes it clear that past climate change induced nomadism. Our nomadic ancestors were few in number and did not have national boundaries. Now every space migrants might move to is occupied by people with property rights, a very real economic challenge. And yet, given the lack of recent data, the analysis assumes migration doesn’t happen.
Impact Lab’s research is much more detailed and extensive than DICE, digging into outcomes like human mortality, but, like Nordhaus’s, it is an effort to use recent outcomes to forecast future changes in order to figure out what climate change should cost in dollar terms. To get to that price, one calculated down to the penny, such research also assumes smooth paths and rules out the most consequential likely disruptions. To paraphrase a colleague, these models assume kids can always go to school, because during the time these models were estimated they always could.
Management
W. Edwards Deming is arguably one of the most important thinkers of the 20th century. He promoted ways of working that were designed to lead to higher quality, less waste, and better processes, especially in manufacturing. His work was dismissed by American companies but embraced in Japan, to amazing effect. Eventually these ideas came back to the United States, along with a selective reading of Deming’s ideas. Most of you have heard Deming misquoted: “If you can’t measure it, you can’t manage it.” In fact, he stressed the opposite, stating that you should measure what you can, but that “the most important figures that one needs for management are unknown or unknowable, but successful management must nevertheless take account of them.”
We are in a tragedy of measurement, using the past as our guide to a future which we actually know will be dramatically different. This problem is about to become acute in California. Science has been warning that fires were likely to get worse. At first insurers and lenders, relying on past experience, ignored these warnings. After last year’s fires insurers realized that they needed to embrace better science, which told them to raise prices and drop some customers, but the California regulator intervened, making it illegal to do either for one year, and requiring companies to use only past fire data when assessing risk. That year will soon be over, and when forced to use only past data, insurers will walk away, as will lenders and prospective buyers.
We use money instead of bartering for many good reasons, but perhaps the best is that a stable currency allows very different things to be valued in a way that makes them comparable. A monetary unit that can accomplish this is called a numeraire. The logic of the numeraire is at the heart of most climate change analysis: climate change will bring so many changes that are hard to compare, wouldn’t it be great to reduce it down to a single number? That is why scientific initiatives have often handed over their work to economists to summarize and offer conclusions. This may turn out to be the most tragic aspect of the rise in the influence and popularity of economics.
Economic models are often worthwhile exercises, not least because they force you to state assumptions and think about how things work, but they have only been good at forecasting the future when the future was smooth. Financial models of the stock and bond markets don’t even need to be good to be useful. If one is right 60% of the time it can make its owners fabulously rich. Yet climate science has been stunningly accurate for more than 40 years and can be used to vividly portray what is coming. Much of what these models foretell cannot be valued.
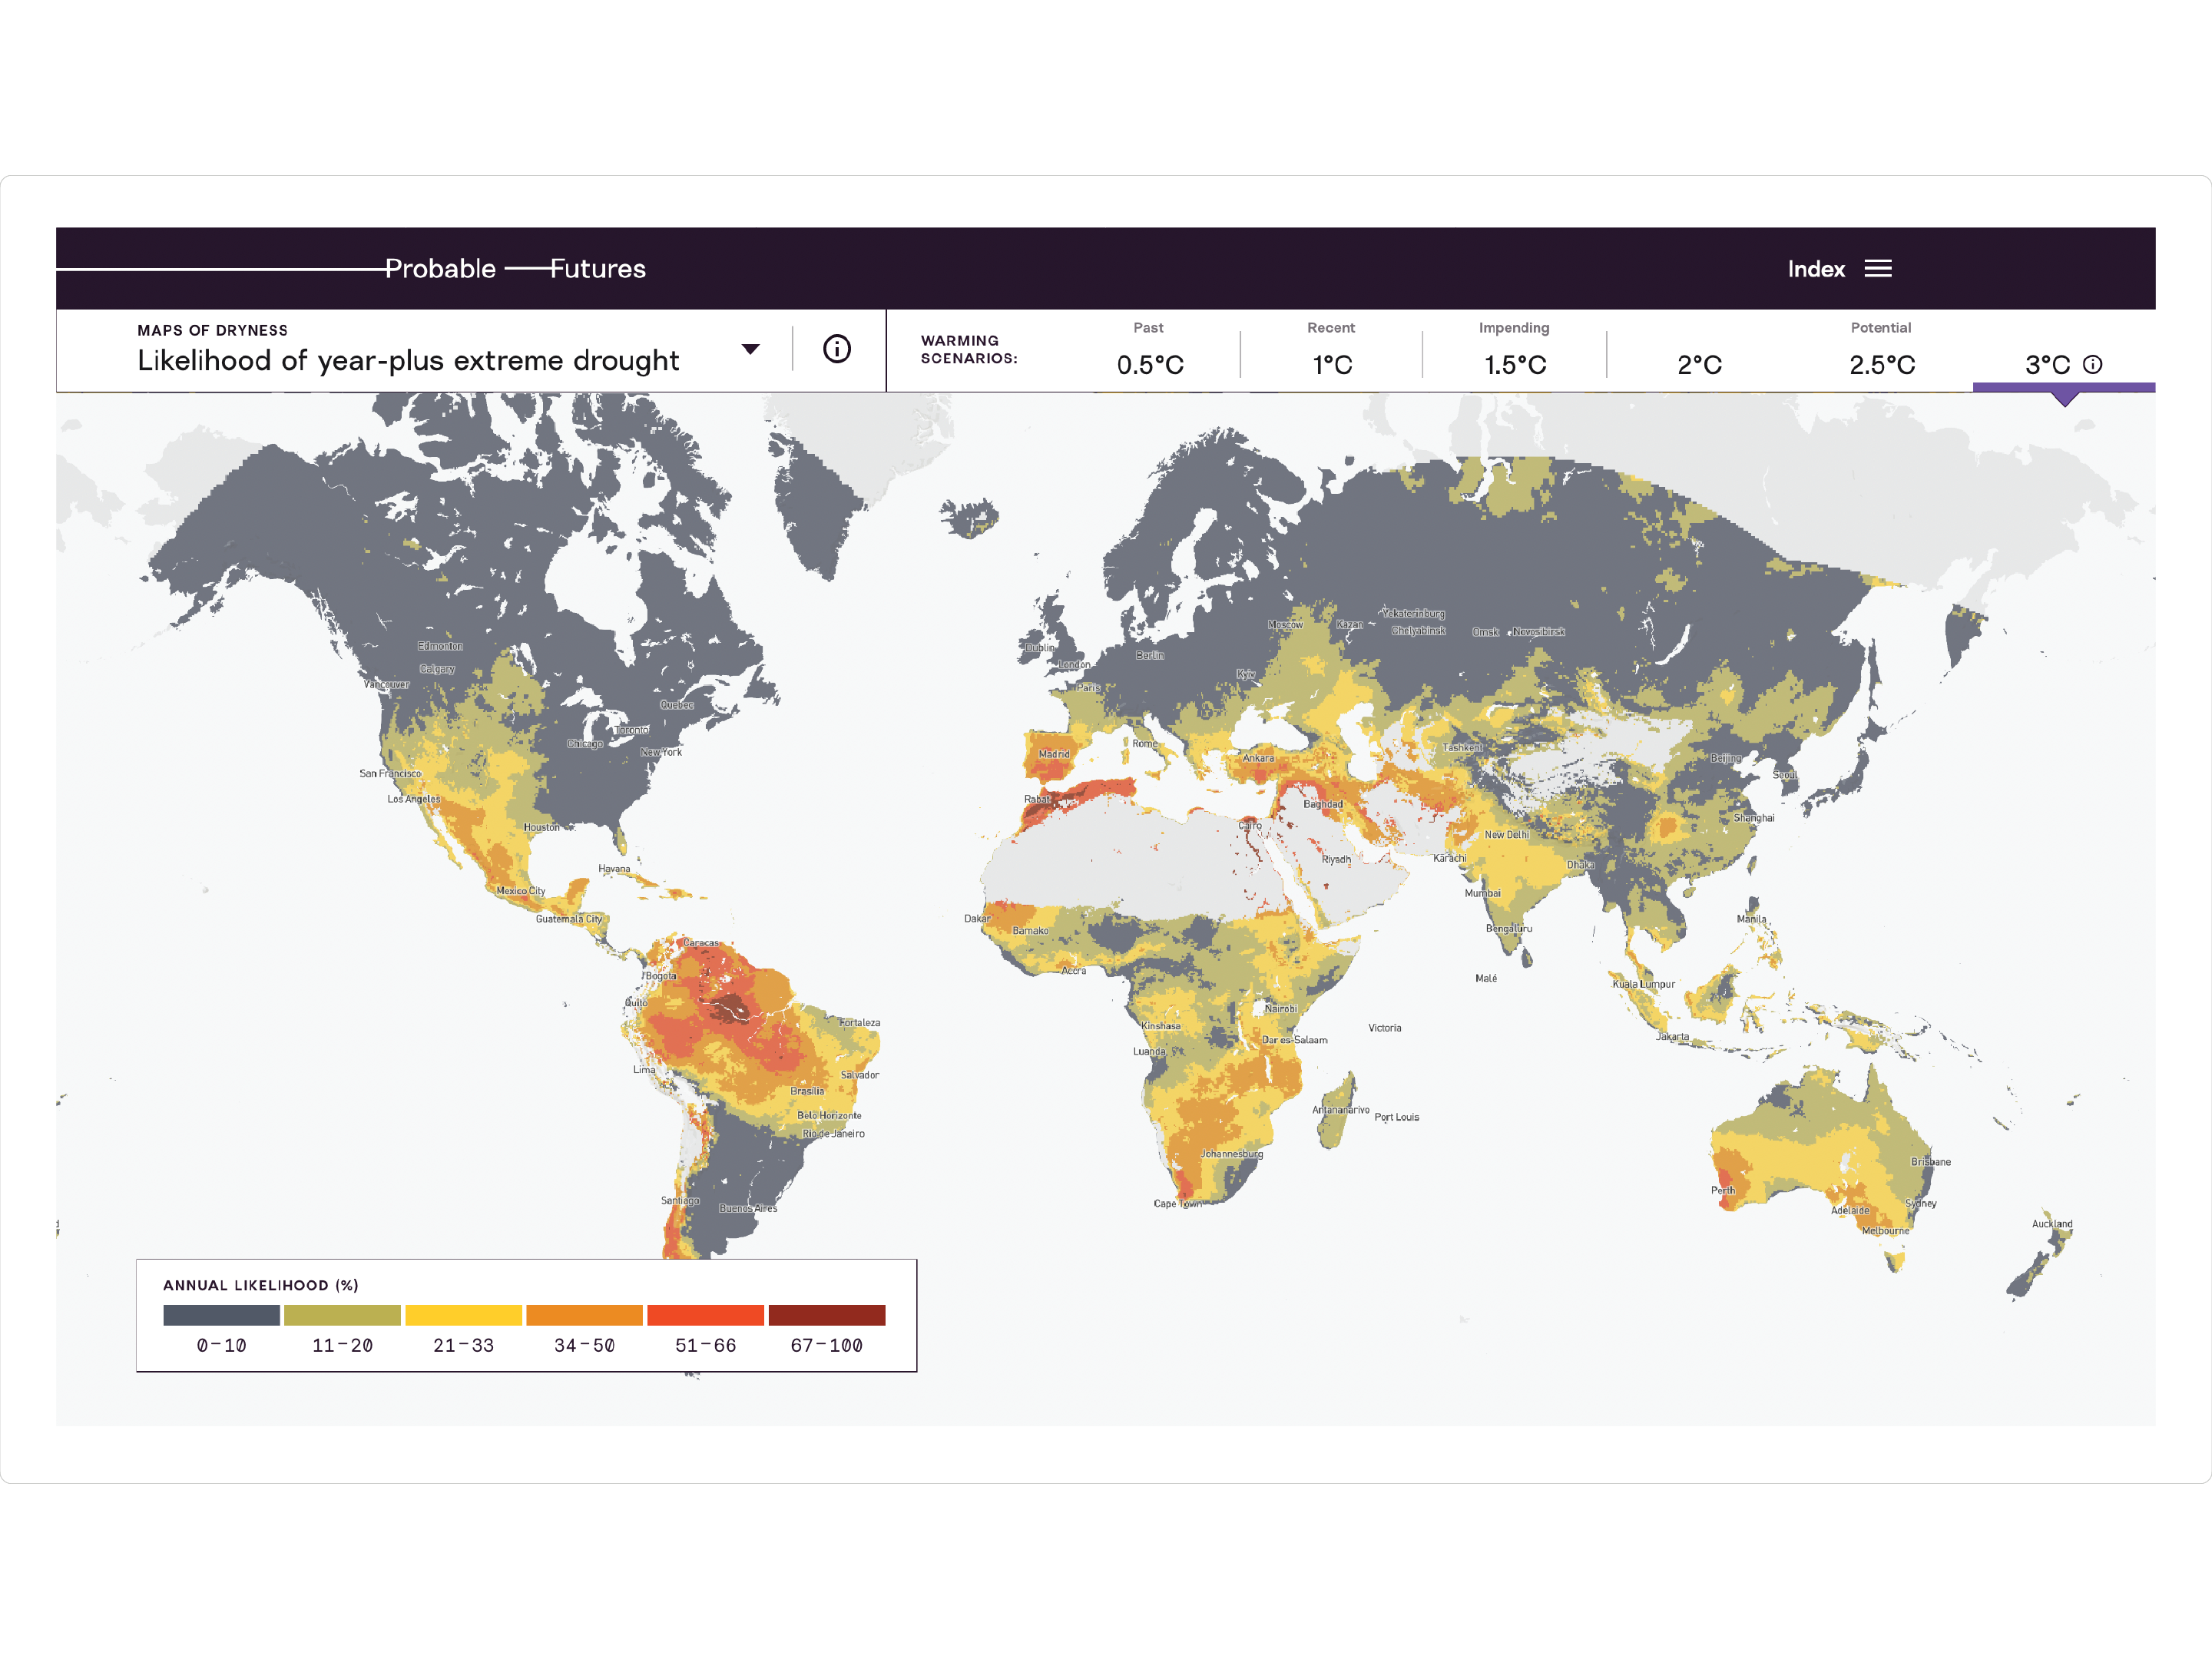
Here, for example, is a map of the probability of extreme drought in a climate 3°C warmer than the stable one we inherited. If the climate were stable, the entire map would be colorless since the probability of extreme drought every year would be very low. Instead, you can see that in many places, especially Mediterranean climates like Southern Europe, South Africa, the inhabited corners of Australia, and California, such drought will be likely every year if we don’t arrest the warming we are causing. That specific climate, right up against a desert and an ocean, receiving just enough rain and just cool enough to stay fertile, is likely to disappear from the planet. It is possible that nowhere will be Mediterranean again. What is that loss worth?
Climate science can be used to tell us the likely consequences of our greenhouse gas emissions. Taking those physical results and squeezing them through the sieve of economic and financial models built to describe recent history forces what is clearly unprecedented to comply with precedent.
Imagination
I highly recommend The Great Derangement: Climate Change and the Unthinkable by the writer Amitav Ghosh. In this nonfiction book Ghosh examines how modern cultural norms and the stability of both the climate and the recent past have limited what is permissible in another important tool for understanding life: the novel. Ghosh points to the Enlightenment as the beginning of this transition:
“…the nineteenth century was indeed a time when it was assumed, in both fiction and geology, that Nature was moderate and orderly: this was a distinctive mark of a new and ‘modern’ worldview… [This] victory of gradualist views in science was similarly won by characterizing catastrophism as un-modern.”
Over time nature receded further and further from our storytelling so that by the mid-20th century, fiction was just about us. Ghosh notes ruefully that:
“…it was in exactly the period in which human activity was changing the Earth’s atmosphere that the literary imagination became radically centered on the human. Inasmuch as the nonhuman was written about at all, it was not within the mansion of serious fiction but rather in the outhouses to which science fiction and fantasy had been banished.”
And so we wind up with visions of the future that are either apocalyptic or barely changed from today, and when something unprecedented, but not actually all that unexpected, happens we increasingly use the colloquial phrase: “If this were in a novel [or model, or a memo, or PowerPoint presentation, etc.], no one would believe it.”
We need new storytelling, by novelists, movie makers, television writers, and all of us, from children tasked by teachers to be creative to adults who imagine their childrens’ future lives. Here is data that might inspire new storytelling. It is essential to how our society works, and anyone can understand it and start to imagine what it means. The below maps of annual days below freezing show how the experience of “winter” will change in the United States if we fail to keep warming below 3°C. If you look closely you will see that the California mountains will lose their snow, the Southern states will be warm year round, the East Coast will no longer freeze, etc. These are specific details, but the overall picture should be clear: everywhere in the country will have a different climate. I could have shown any other part of the world and the picture would have been comparable.
Freezing Days
The outside comes in
I have looked at the temperature graph I showed at the top of this email many times. I think it’s worth showing the graph again and focusing on the far right. We are already 1.1°C above the period of long stability, warmer than it has ever been since humans settled. The last little bit of the graph on the end is in a different color and shows the path we are on. As you can see, there is no precedent in the rest of this history for stability even 1°C higher than the interglacial average.
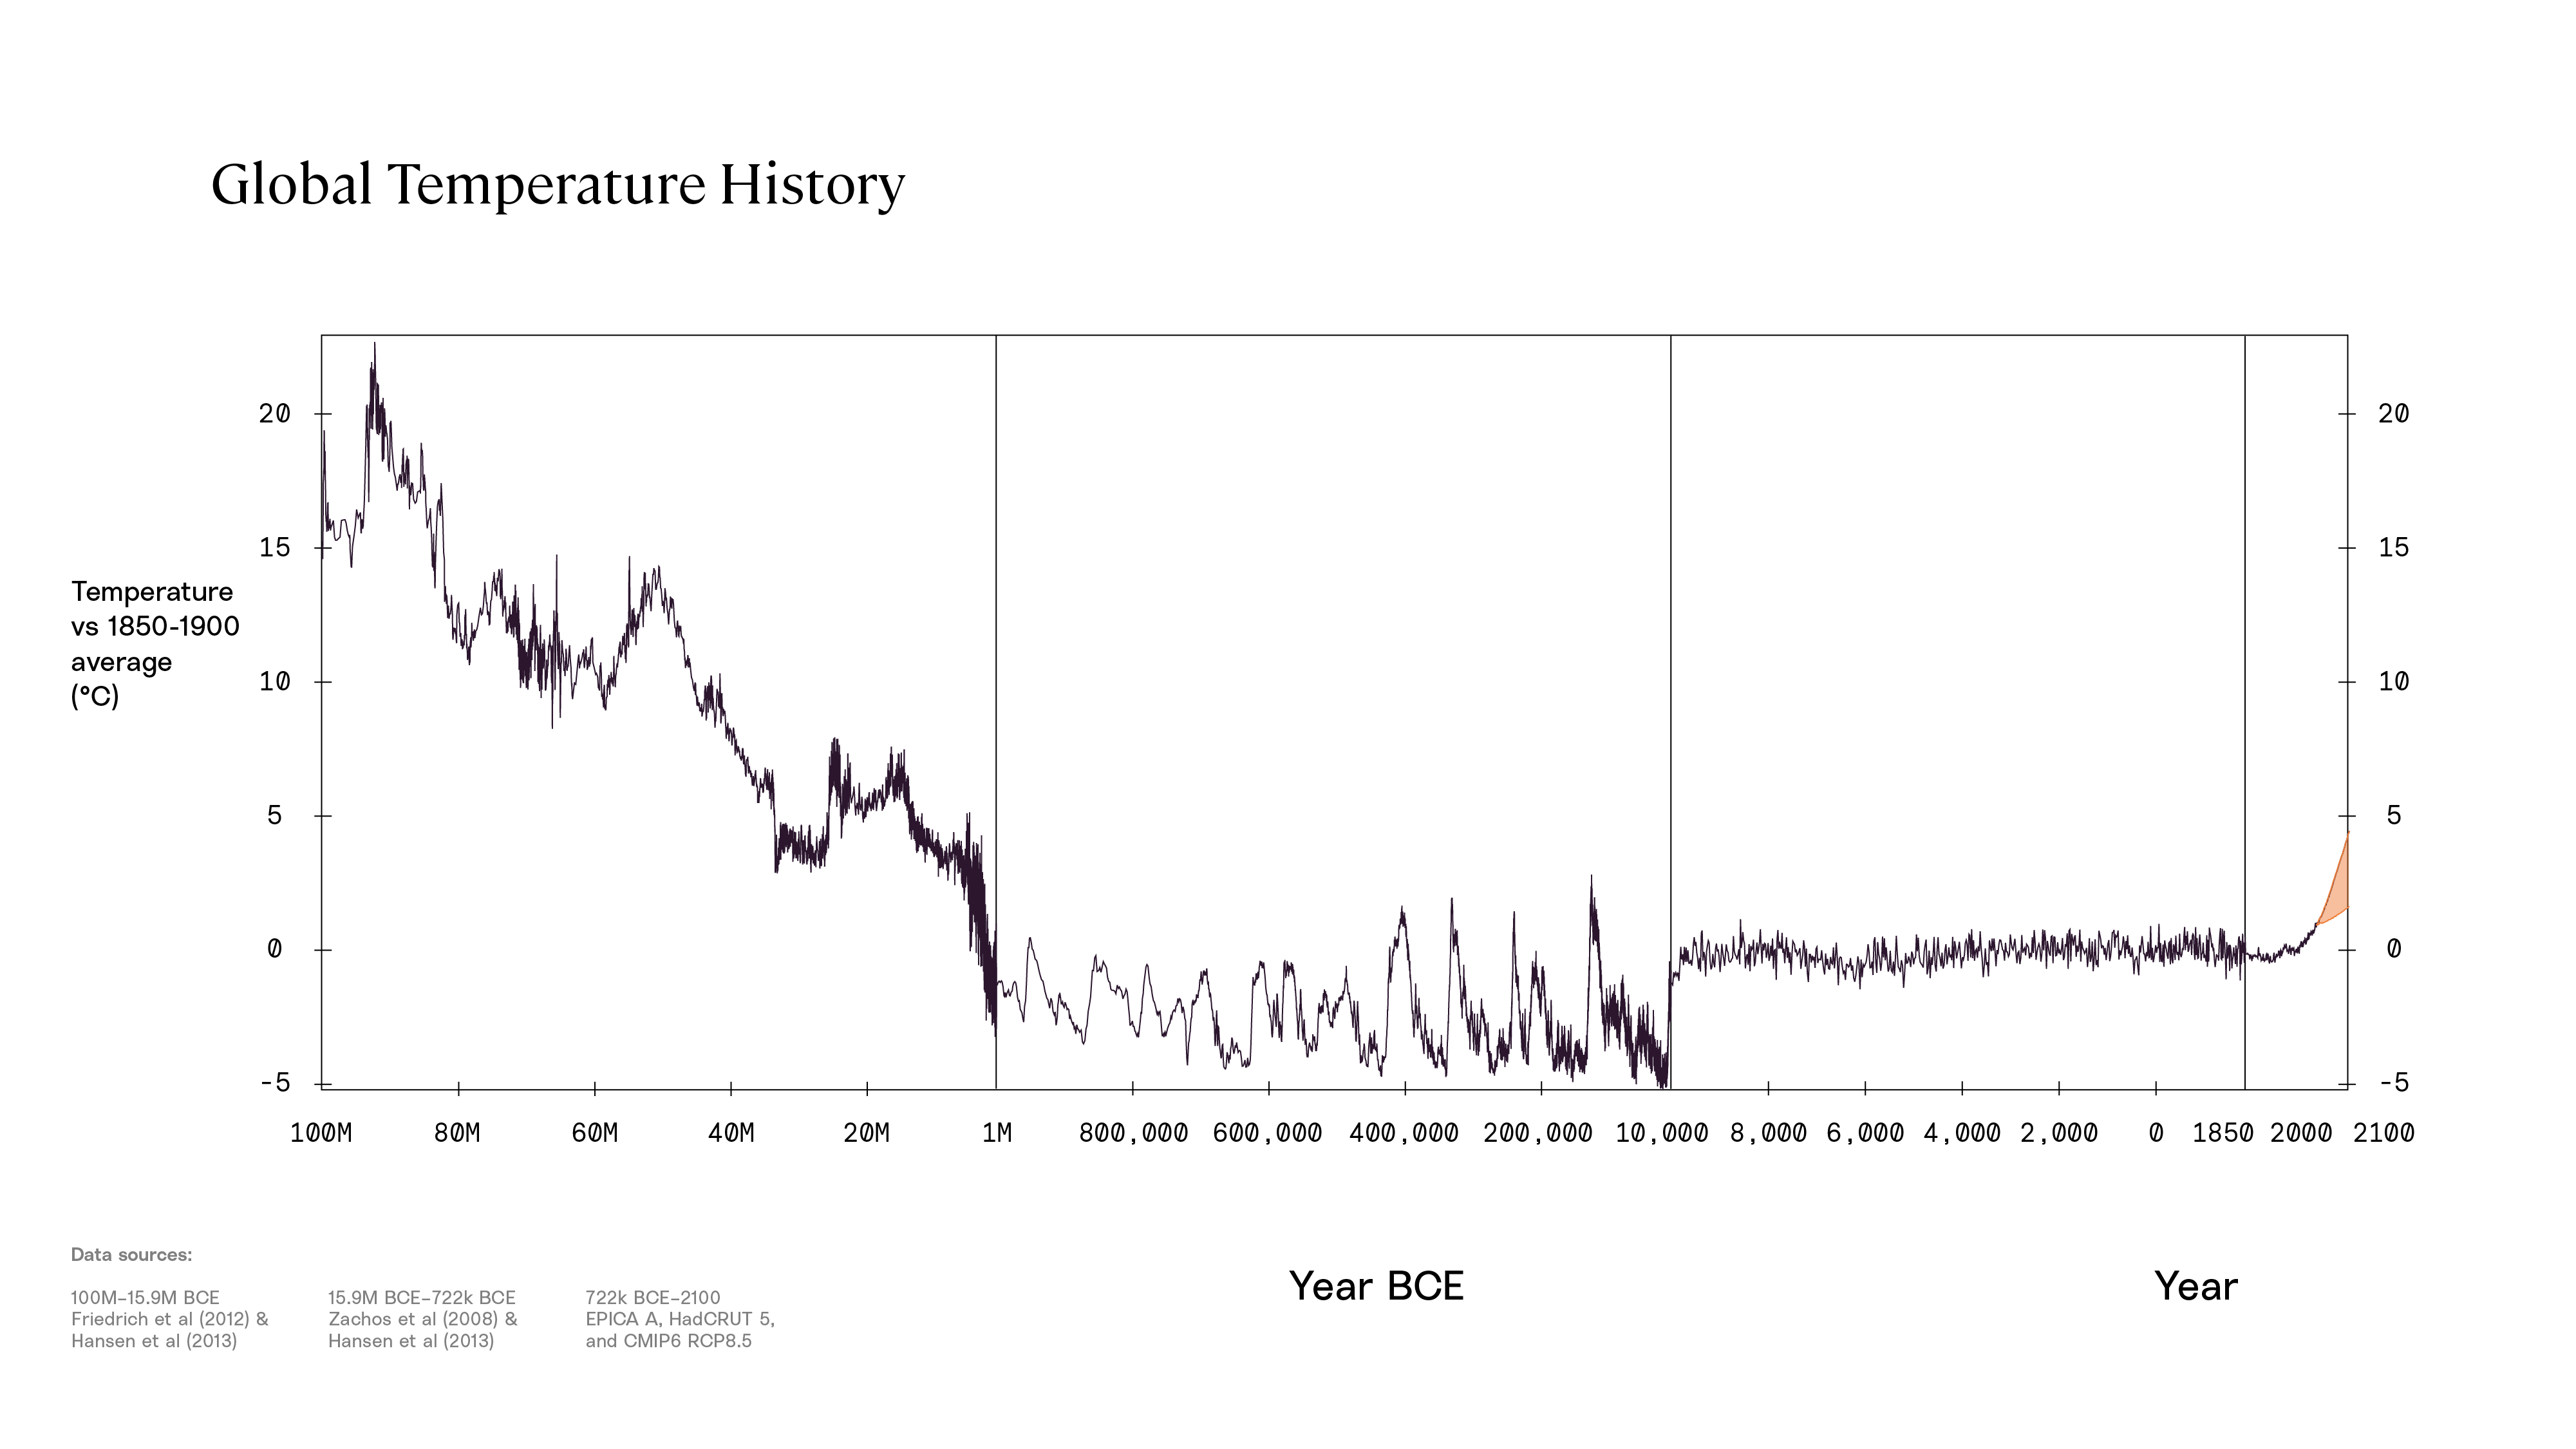
Should we pass 2°C there is good reason to expect that we will break both our recent stability and the million-year cycle into which our species emerged. Indeed, new cycles have already begun, from melting permafrost to disappearing glaciers. Each of these phenomena is a response to warmer weather and creates yet warmer weather, either by adding heat-trapping molecules to the atmosphere or by making the surface of the Earth less reflective, thereby increasing the heat our world takes in. Somewhere beyond 2°C lies not a new stability but a path upward that would be essentially impossible for us to stop, and unlike the orange line here, or virtually all of the models that inform the “cost of carbon” discussion, there is no reason to believe it will be smooth. Instead of familiar patterns like apple season or ski season, today’s youth and tomorrow’s children will face ever-expanding fire seasons, storm seasons, and others we haven’t yet recognized.
We need new ways of thinking, and we need to start using imagination when we think about the weather ahead, the life we will lead in it, and how we will prevent worse outcomes. The models of modern economics and finance are not going to be helpful unless we force them to reckon with the fact that the future will be different than the past. Even then, we should not think of them as forecasts but as inputs, and almost always best-case inputs. Similarly, climate models need to be employed with the understanding that the risks outside of the models are disproportionately hotter and worse for our wellbeing and almost all the life around us.
What is to come
In my last letter I talked about the interactive maps that Probable Futures will offer. Those have taken a bit longer to make than expected, largely because our collaborators at the Woodwell Climate Research Center are continually finding better ways to portray what is coming, including asking questions like, “How do you model fire season in a place that never had one before?” The work is worth a bit more wait.
By now you shouldn’t be surprised to know that Probable Futures will not offer precise forecasts and will never translate results into monetary values. Other people are welcome to do that with the tools we provide, but we will advise them to do so prudently, with a risk mindset. Our platform and programming will tell people in practical terms about the heat, drought, wildfire, rainfall, and storms that are probable, and sponsor and encourage demonstrations of how those phenomena will challenge life as we know it. We are encouraged about Probable Futures’ usefulness and are working hard with our partners to build a platform that will make information about climate change tractable, vivid, resonant, and useful. Our ambition can be imagined as an intervention on that same graph: to help the line continue into the future without losing stability.
That is the story behind our logo, designed by our collaborators at Moth Design:

The long line and most of the letters are the stable past, portrayed by a rich purple, balanced between a hot red and a cold blue. At the end the color changes. This change doesn’t have to be for warmer, so the letters don’t tilt up, but it has to be different.
We hope you will join us in our efforts.
Onward,

Spencer