Greetings at one of the two most extreme moments of the year, the June solstice. The Northern Hemisphere is bathed in sunlight and the Southern Hemisphere is as dark as it gets. The center of the sun is directly in line with the Tropic of Cancer, 23.44° north of the equator, as this letter leaves one server on its way to many more and eventually, perhaps a second or two later, to your device.
“Just right” where you live
The most intense solar radiation is always between the two tropics, while the Arctic and Antarctic oscillate between light and dark. These are profoundly important sections of the Earth, but this letter is addressed almost exclusively to people in the bands in between. Probable Futures is just getting started, but we are fortunate to have interested people on every populated continent. When it comes to climate, however, almost everyone I am writing to is in the same kind of place. Your local climate is likely temperate with discernible, predictable, well-spaced seasons. Your summers are warm or even hot, but not too hot, and your winters are cool or even cold, but not unbearably so. You live where the climate has historically been just right.
I am writing as part of an effort to help you truly understand that for about 12,000 years the Earth had a specific, stable climate, and on this stability we built modern civilization overwhelmingly in a small number of specific sub-climates. Humans didn’t settle down until the climate stopped changing, and when we planted crops and built towns and cities we did so in mild places. Changes to the aggregate climate, and especially to the local sub-climates, will be disorienting, disruptive, and painful, and will likely lead to violence. In order to avoid the worst outcomes and imagine how we might live in the better ones, we all need to pay attention to our actual, physical world. We will then need to use the intuitive, powerful knowledge that is available to us to both avoid the worst and prepare for the probable. This is what Probable Futures seeks to do.
How we see the world
Modern tools, perhaps especially Google Maps, have contributed to our collective loss of direction. Google’s maps don’t stay pointed north but instead turn to orient the world to our motions and our desires. This seemingly benign convenience contributes to the sense that the world is built around us. Copernicus was punished for suggesting that the Earth wasn’t the center of the heavens; modern people are encouraged to think that we ourselves are the center of everything.
Despite the change in our perceptions, the terms of reality haven’t changed. What we call “our world” is governed by physics, biology, and chemistry, not by our individual desires or locations, even if every space we inhabit is climate-controlled and our maps are built to guide us seamlessly to that newly-reopened restaurant with the contactless takeout without ever having to look around.
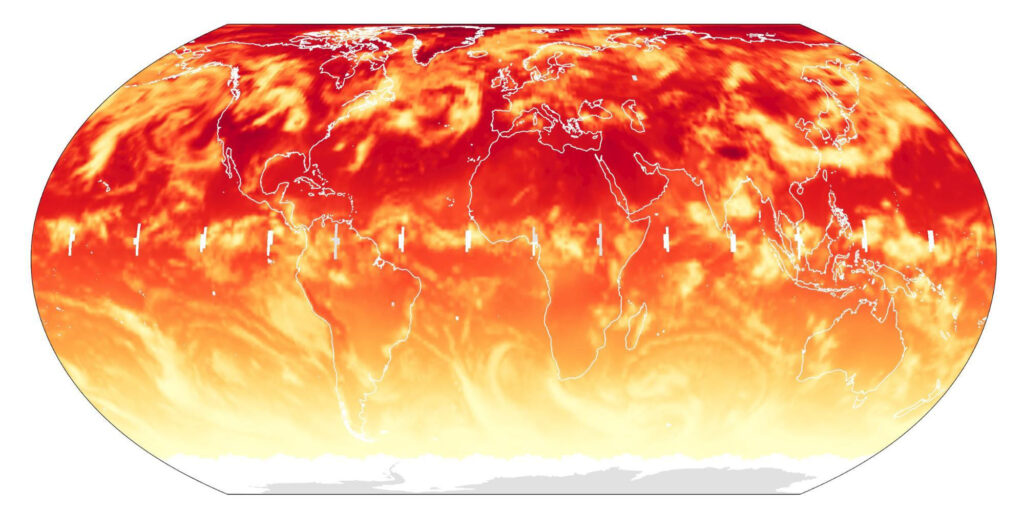
Our team at Probable Futures is thinking carefully about maps and their ability to either accurately represent or distort the world. Our goal is to orient people both to the world as it has been and to how it is going to be as the climate changes further. Here is a map that captures the effects of the solstice well. It shows the amount of solar radiation to hit the surface of the Earth over the entire 24 hours of last year’s June solstice, courtesy of our colleagues at the Woods Hole Research Center (WHRC). The darkest red places were hit with huge amounts of solar radiation, while the white areas never saw the sun. The swirls of yellow and orange show where clouds blocked the sun’s rays. I find it amazing that Greenland is darker than Saudi Arabia. Saudi Arabia is on the Tropic of Cancer where the sun was the absolute hottest, while Greenland’s rays were much weaker. Since it gets 24 hours of sun on the solstice, however, Greenland winds up being hit with more energy than Riyadh.
In addition to determining the location of the Tropic of Cancer, the positioning of the sun at this very moment dictates the location of the Arctic Circle, 23.44° south of the North Pole (both reflect the 23.44° tilt in the Earth’s axis relative to the sun).
The Arctic offers radically different surfaces to the incoming sunlight. Greenland may be exposed to more energy from the sun than tropical locations, but it is almost completely covered by bright ice which acts as a mirror, reflecting the majority of light—and its heat—back into space. Exposed land, however, absorbs most of the light that strikes it, translating it into both heat and new plant growth. And the dark blue ocean absorbs almost all of the energy in sunlight. You have likely heard that there is much less Arctic sea ice than there was in the past. This affects the energy balance of the entire planet: the less ice there is, the more heat our world takes in.
If the ice in the Arctic is a mirror, the land there can be thought of as a bank. The Arctic is home to enormous expanses of what is called permafrost, frozen soil filled with the remnants of plants that grew briefly one summer and then were frozen and buried before they fully decomposed, locking their newly photosynthesized CO2 in the soil as organic matter. WHRC scientists have been visiting, studying, and monitoring the Arctic for many years. This past year WHRC’s Sue Natali was the lead author on a paper titled “Large loss of CO2 in winter observed across the northern permafrost region” that showed that in the regions of the pan-Arctic, permafrost is now releasing about 60% more CO2 in the winter than the summertime plant growth in those regions pulls from the atmosphere.1
Put these two changes together, and the Arctic has gone from a stable mirror and sink of carbon to an absorber of heat and a source of greenhouse gases, thereby both increasing the energy our world takes in and adding to the heat-trapping power of the atmosphere. The warmer the Arctic gets, the more perilous the Earth’s entire climate becomes. The Earth’s climate is already more than 1°C warmer than it was before widespread industrialization, and the Arctic is warming about three times faster than the average, a result foreseen decades ago by scientists including WHRC’s founder, George Woodwell.
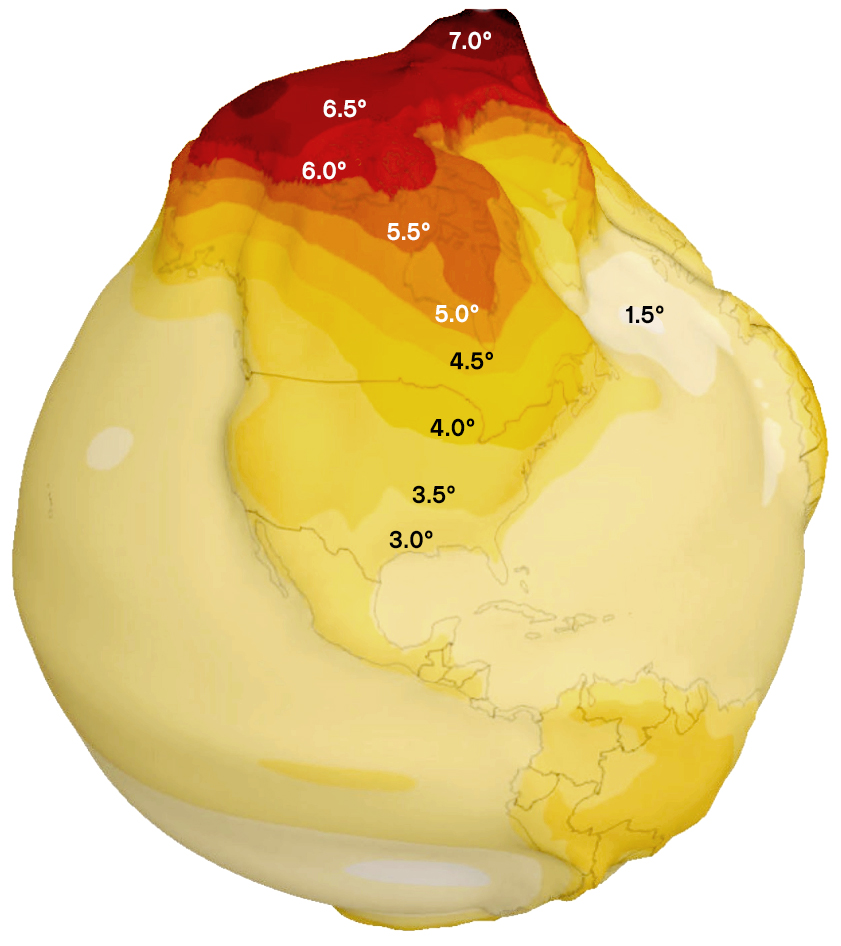
WHRC’s Greg Fiske created this graphic earlier this year to illustrate how unevenly the Earth is heating. Greg took a spherical globe and then distorted every part of the globe proportionately to the amount it will warm if the atmosphere warms by 2.5°C. 2 The oceans warm less than the land, and the further north you look, the more warming you see. Perhaps you have wondered why “under 2°C of warming” is a focus of climate action. Greg’s graphic provides the best visual answer I have seen. The Arctic has already warmed by over 3°C. If temperatures rise to +7.0°C (12.6°F), the additional melting of ice and permafrost will push our climate much further from equilibrium.
“The human niche”
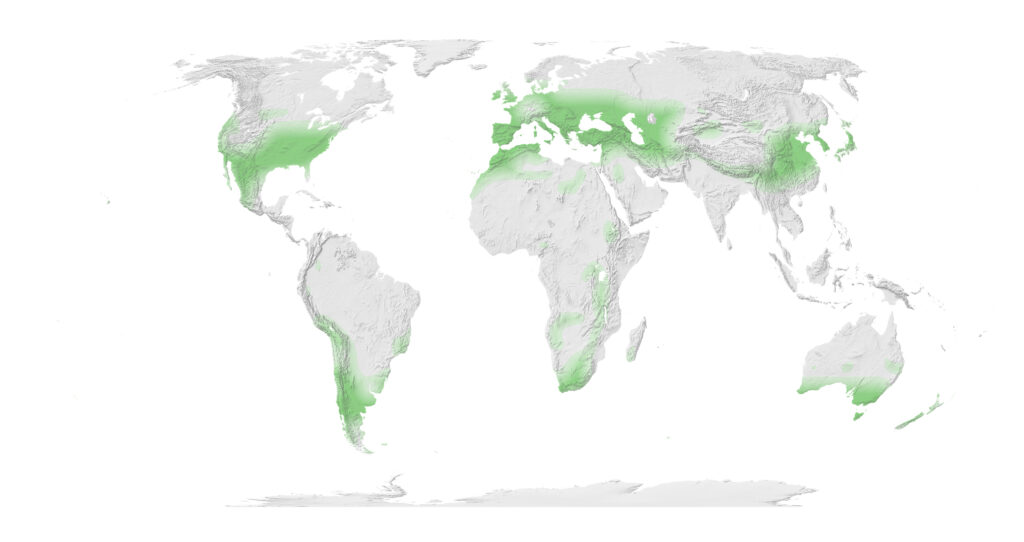
A recent scientific paper refers to a narrow range of temperatures as “the human niche.”3 The authors show that humans’ affinity for this niche has been steady for at least 6,000 years. It’s where most of the world’s population gathered and grew, and it is an eerily precise map of modern prosperity. The paper is a bit complicated in its methodology, but a simple approach yields the same basic results: the map below, also created by the team at WHRC, highlights places that had an average year-round temperature around 13°C (55.4°F) in the pre-industrial era of 1860–1910.4 The recipients of this letter are overwhelmingly prosperous people. If you look on the map for your current location, it is very likely that you are in a highlighted area.
The Earth’s climate is driven by forces that scientists have been discerning and codifying for hundreds of years, but you need only to know basic, intuitive things to grasp the most important aspects of climate change. The above map is a perfect example: our predecessors consistently gravitated to, and flourished in, mild places, and we have followed the same pattern. Of course some people did live in the hotter and colder places, but rarely in large numbers, with modern-day India as the only major exception. It is essential to note that colonialism and other brutal forces further biased prosperity toward the temperate climates, but as noted in “The Future of the Human Niche” paper, humans’ attraction to mild climates goes back at least 6,000 years.
The fact that life, especially for large populations, is easier in mild climates might best be illustrated by examining the only two “rich” places on the Earth that have either a hot desert climate or a tropical humid one: Arizona and Singapore (I am not counting places where there are a few people made exorbitantly rich by oil and minerals). That’s essentially the entire list. Those places have not been populous or rich for long. They were simply not habitable at high density until very recently, and the people who live in those two places depend every day on massive, costly infrastructure to make life work. From ubiquitous, nearly constant air conditioning to heroic, complicated water management, to specialized materials to deal with the heat (and humidity in Singapore), they are engineering marvels.
Arizona and Singapore prove that prosperity can be attained in such places (so long as you can import lots of things from elsewhere), but a common-sense look at the infrastructure required to make these previously inhospitable places prosperous reveals robust governments, huge, costly public and private investments, and extraordinary maintenance. It might also make you wonder, “What will happen in those places as they get even hotter?” or “What will become of places that are as hot or even hotter but that lack their proximity to essential resources or institutions and pools of capital to underwrite that costly infrastructure?”
The “Too Hot” Climate and the Future of “Just Right”
Humans, especially in the last few decades, have moved into almost every part of the world, going right up to the edges of livability, and increasingly act as if those edges don’t matter. As a simple example, many of the worst loans in the run up to the 2008 financial crisis were for development in the deserts of California, Nevada, and Arizona, where extreme heat and extreme drought were already challenges, and the swamps and coasts of Florida where fresh water, heat, and humidity were problematic. Land was cheap in these places because no one had tried to live there before. Over the course of the 30-year mortgages offered to those borrowers the relevant edges are going to get closer and more severe.
While Americans migrate toward climate peril, unconsciously ratcheting tensions around who will help whom and how as heat, drought, fire, inundation, and storms imperil some parts of the country and not others, even more profound physical and moral challenges are accumulating in and near the tropics.
To reiterate, the “human niche” concept doesn’t exclude life in hot places. It merely recognizes that while people have lived in hot places for thousands of years, they have tended to do so at low population densities. Indeed, people who lived in these places lived in their own diverse ways that were suited to the heat and strains of the climate, often in harmony with nature. Now, however, societies in already hot places are growing in numbers that will require the kinds of institutions and capital that make Phoenix and Singapore viable at scales that even Phoenix and Singapore haven’t had to consider.
Among the hottest places on the planet are the countries of the Middle East, Pakistan, Bangladesh, and extensive areas in Africa. Together these lands are four times larger than the continental United States and in 1960 were home to about 400 million people. Today they are home to 2 billion people, and will likely see their populations grow by more than 400 million just in the next 10 years. As the populations in these places rise, so will the local temperatures, crossing thresholds that no human has ever experienced. Neither the population growth nor the climate change forecasts are speculative. They are extremely likely. And they have no precedent. Maybe you already knew these facts and had fully processed them. We hadn’t. And when we learned them and thought about what they might mean for society, for nature, for institutions, and simply for what it means to be a person in a world where these things will be true, we decided to stop doing anything else and find ways to make them common knowledge.
The answers to questions about how we should act, how we should prepare, what we should hope for, or what we should tell and teach our children are not obvious or easy, and we at Probable Futures won’t be offering answers or judgments about them. We are, however, certain that if leaders of all kinds don’t learn and internalize these truths about the physical world and then interrogate their assumptions about stability, we will create a worse future—and be ill-prepared for it.
What’s coming from Probable Futures?
I wish this were a happier letter. We could all use injections of cheer in our inboxes. Yet my collaborators and I are confident that the best thing we can offer is clarity about how our world works and what is to come. We are excited to share much more with you in the coming months. We aspire to keep our work clear and useful while also conveying the beauty and wonder of our physical world.
In the next month or so, Probable Futures will be releasing a prototype website which will share some early analytics. By late summer or early fall we aim to release the first installment of the Probable Futures platform which will focus on heat. There will be case studies and an interactive mapping tool that our collaborators at Postlight and WHRC are building so that people everywhere on Earth will be able to see what escalating levels of climate change will mean for their community and every other community on earth. In the months that follow the platform will expand to offer locally specific forecasts of drought, wildfire, rainfall, and tropical storms.
By this time next year we expect Probable Futures will offer distinctive, world-class tools to visualize climate change at the local, regional, and global levels along with case studies and insight to help people understand what those changes mean. We think this information will be useful to everyone, from local governments to new parents and from CEOs to poets. Because it is useful to everyone, we will make it available for free, without advertisements, solicitations, or any form of monetization. The understanding of how our world works is beautiful and essential. It is a gift that should be given to everyone.
I wish you and your loved ones well and hope that during this time when we are all living quite differently we might imagine and discover ways to live that are better than going back to the prior “normal.” If we don’t learn to change on our own, the climate will force us to, offering us many fewer options that feel “just right.”
If you would like to receive future letters or an invitation to see our prototype when it is available, or if you just want to say hello, we’d be happy to hear from you at hello@probablefutures.org. I hope you will stay interested.
Onward,

Spencer