In the early days of the Covid-19 pandemic, a group of journalists and data scientists formed the COVID Tracking Project at The Atlantic with a simple mandate: to collect reliable data about the spread of Covid-19 and share it with the public. Hundreds of volunteers–journalists, researchers, engineers, and students-joined the project, and their reporting and data visualization have been cited in thousands of academic papers and news stories.
In 2021, a group of former leads and key contributors from the COVID Tracking Project formed the Pandemic Tracking Collective (PTC.) They partnered with the Rockefeller Foundation’s Pandemic Prevention Institute, where their scope of work refocused on risk mitigation for the future. The following year, PTC began integrating climate into all of its work streams.
Data scientist Jonathan Gilmour and data quality lead Michal Mart—not climate scientists by training—needed to find primers on climate change for themselves and their team and high-quality data to support their work.
Public health and climate intersect, and they’re inextricable. Our team has deep experience in public health and epidemiology but limited experience in climate. Probable Futures was a great starting point for many of us to get into learning how fundamental elements like heat and water are changing.
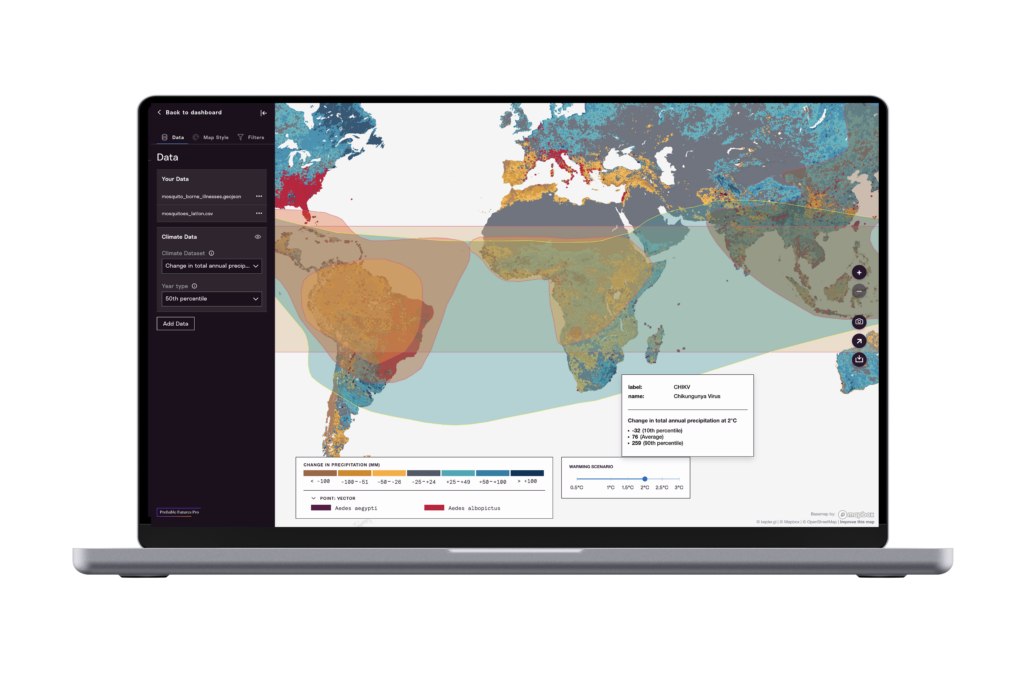
The team first utilized the Probable Futures platform and interactive maps as a primer on how global climate change will manifest changes in heat, precipitation, drought, and wildfire. Then, using Probable Futures Pro, team members were able to overlay climate data with publicly available health data relevant to infectious disease.
Mart, a resident of Dutchess County in New York State, the county with the most Lyme disease cases in the U.S., investigated how different warming scenarios would impact the spread of deer ticks, who prefer temperatures over 45°F. After making maps that combined information about climate and deer ticks in Probable Futures Pro, Mart’s next challenge is publicly sharing her findings in a compelling visual and data-driven format.

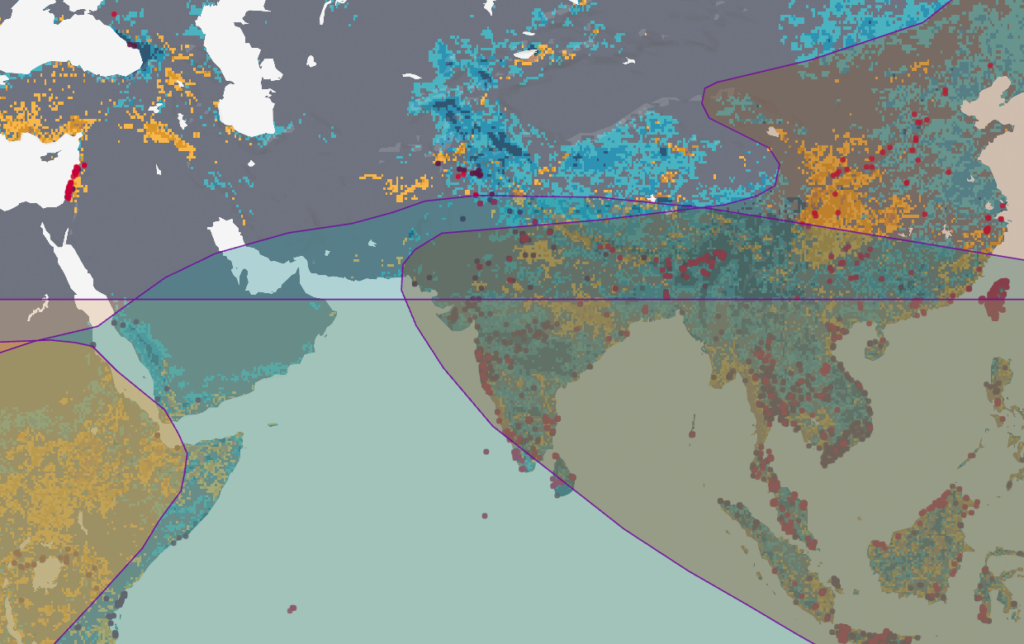
Gilmour used the Pro tool to examine how vulnerability to mosquito-borne illnesses might change in a warming climate. Focusing on the tropics and subtropics, where the highest rates of mosquito-borne illnesses can be found, Gilmour explored climate impacts like increasing heat and humidity that correlate directly to mosquito behavior. Gilmour’s findings will be used in a case study diving into the intersection of climate and mosquito-borne illness on a global scale.

It’s sobering data, but it’s a great way to visualize these second-order impacts of a warming climate. We’re not looking directly at how climate change affects people but at how increased heat and rainfall will help these mosquitoes. For example, increased rainfall means that rain will collect in things like used tires or trash, providing more breeding opportunities for mosquitoes. Some studies show that mosquitoes will fly more and be more active with heat or rainfall. It’s not a direct connection, but these things will affect mosquito-borne illnesses, and we’ll have to stay on top of that health issue as the climate changes.