Decades ago, scientists developed the first climate models to simulate what weather around the world might look like as global average temperatures increase. In the years since, those original climate models have predicted the scope of changing temperatures with impressive accuracy, even as scientists expand and refine new versions.
These models, and the projections they show, can help us make risk-informed decisions about the future. To use climate models effectively for decision-making, we need to first understand how they work and what they do best.
What are climate models?
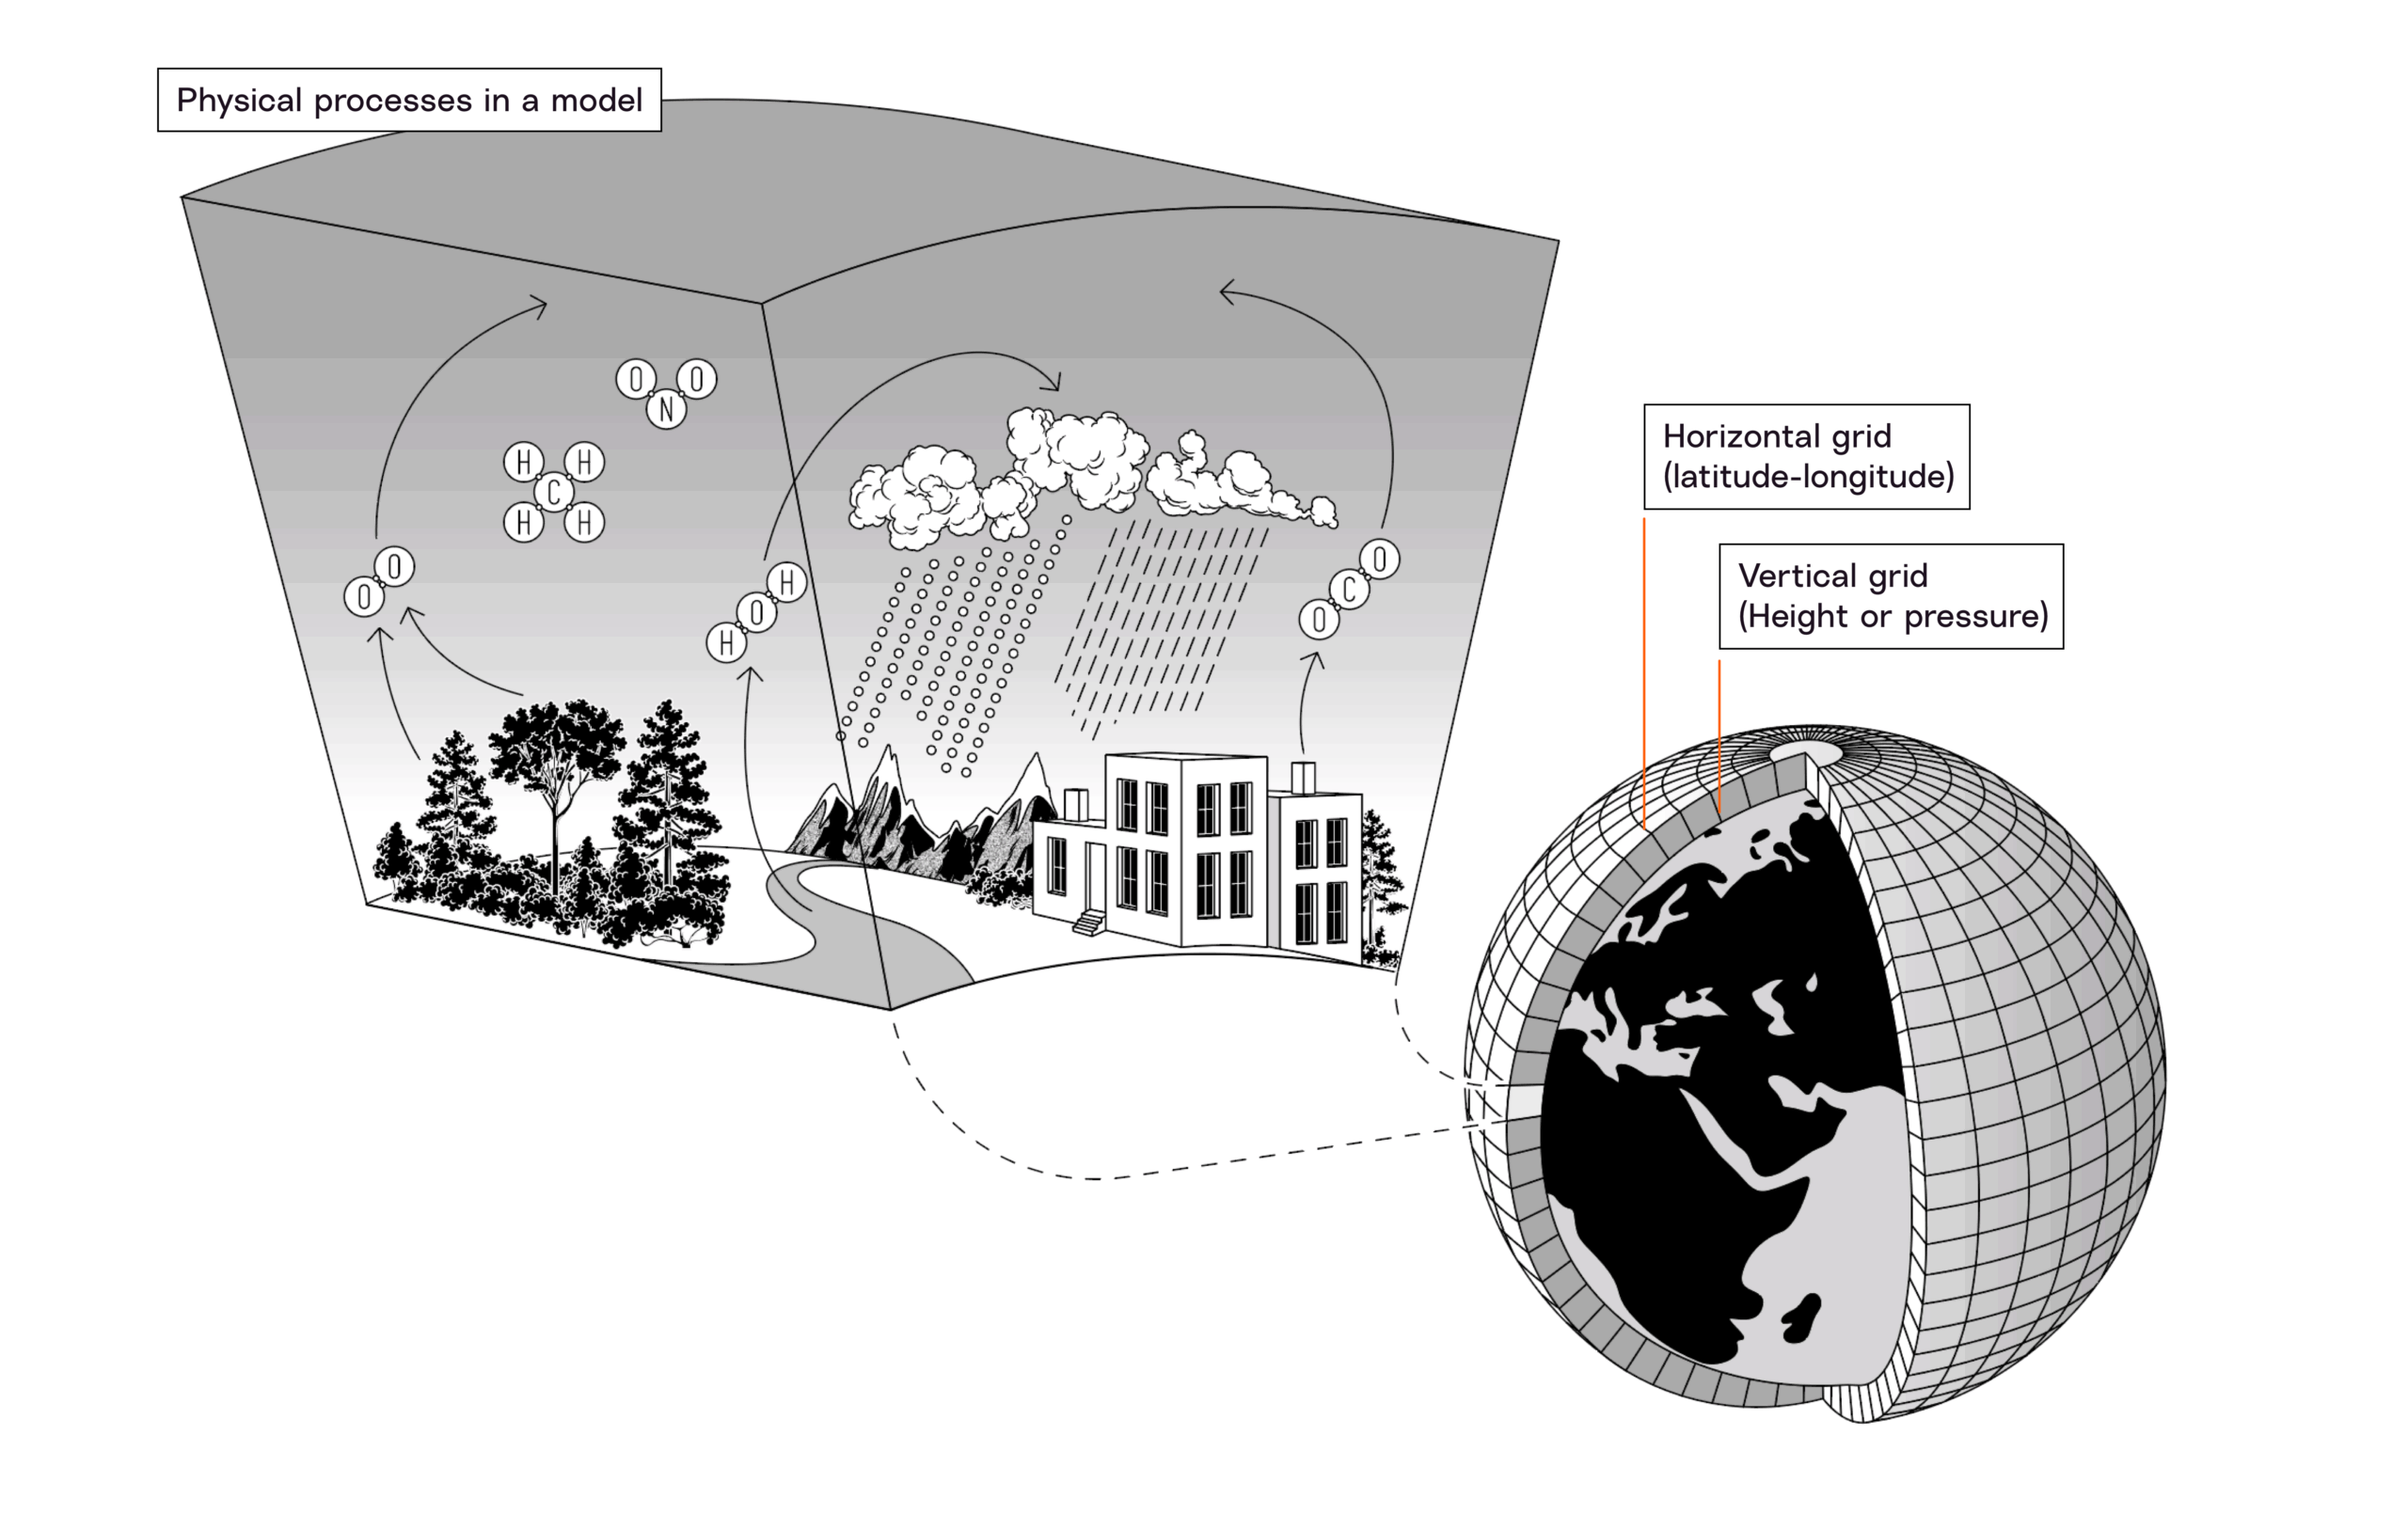
Climate models show what Earth’s climate could be like, including temperature and precipitation, based on greenhouse gas emissions warming Earth’s atmosphere. Scientists at research institutions create climate models by dividing Earth’s surface into three-dimensional grid cells and using equations to calculate how aspects of the climate, like energy, carbon, and water might change, interact, and move across those grid cells. Climate models project conditions decades, or even centuries, into the future.
Types of climate models
Climate models vary based on the size of the model’s grid cells: Global circulation models (GCMs) simulate the climate on a global scale; regional circulation models (RCMs) downscale GCM results to simulate the climate on a regional scale. All climate models originate from the same initial source: GCMs.
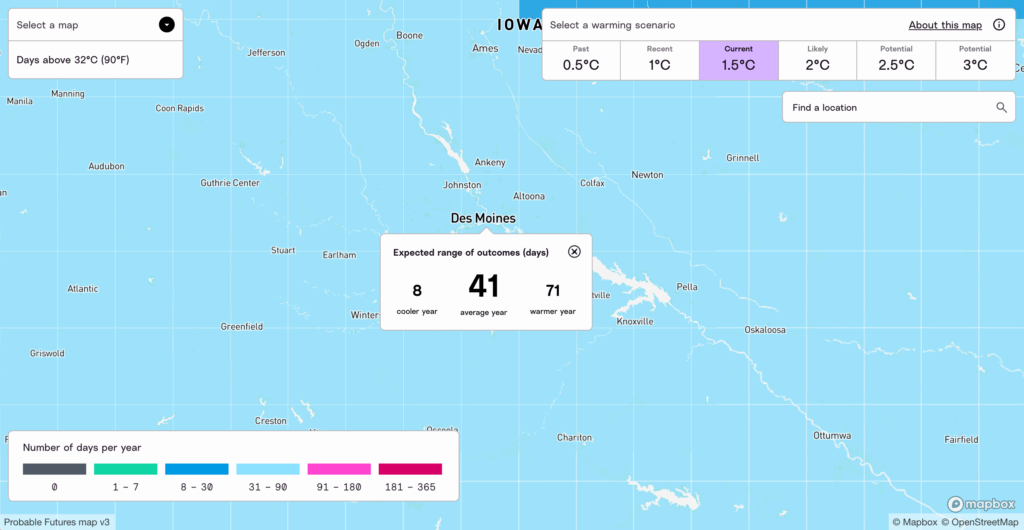
Days over 32°C (90°F) at 1°C of warming
-
0
-
1-7
-
8-30
-
31-90
-
91-180
-
181-365
RCMs are more granular and detailed than GCMs.
Most GCMs have a grid cell size of approximately 150 to 250 kilometers on a side. Because of the size of these grid cells, GCMs simulate climate conditions across larger areas, not weather on a local level. For example, a GCM can capture the dynamics of shifting precipitation patterns across Scandinavia, but not the variation in rainfall from one side of a single mountain range to the other. To get local projections from GCM results, scientists can use one of two techniques: statistical downscaling or dynamical downscaling.
In statistical downscaling, scientists add detail to the results of GCMs with historical weather observation data. In dynamical downscaling, scientists use GCM projections to run smaller, more detailed RCMs. RCMs have grid cells that range from 10 to 50 kilometers to a side. Because RCMs are so detailed and require so much computing power, scientists divide up Earth’s surface into smaller regions and run individual models for each region.
The strengths of climate models
Climate models are best at projecting a range of outcomes, from least to most likely, that indicate trends across a region.
Showing regional and global trends
Climate models excel at showing the way climate and weather will shift and transform as the atmosphere warms. Over recent decades, observed weather trends (for example, a region becoming drier, wetter, or hotter) have generally mirrored climate model projections made decades earlier. Climate models perform best at the regional or continental scale, and have practical limits when it comes to projecting weather on a local scale.
This gif shows the shift of climate zones while atmospheric temperatures rise.
Climate model projections are strongest at lower degrees of warming—when the global climate is most similar to the predictable climate of our recent past. There are forces in our global climate, like ocean and wind currents, that greatly influence weather but might behave in unfamiliar ways at never-before-seen levels of warming. As our global average temperature rises further above the preindustrial baseline, these forces may change and, in turn, disrupt weather in ways that climate models do not anticipate.
Projecting distributions and ranges
In everyday life, the weather varies from day to day, season to season, and year to year. A specific day of the year—say, October 31—in a given place might be warm and sunny one year and cold and snowy the next. One important strength of climate models is that they reflect the randomness and variation of weather in their projections.
In a climate model, every simulated day in every grid cell of a climate model contains data for high and low temperatures, quantity of precipitation, and more. To test how these outcomes might vary, scientists can run climate models repeatedly and simulate one year several times or even hundreds or thousands of times under slightly different conditions. The resulting simulations show not just how much the climate will change on average, but also what variation might occur and what the less-likely outcomes could be.
Seeing this range of possible outcomes, from the less-likely 5th and 95th percentiles to the most-likely average outcome, as shown in Probable Futures maps, helps present a full picture of what may occur in a given place.
Assessing risks
Lastly, what makes climate models such a useful tool is the potential for assessing climate risks. The severity of any given climate risk depends on local exposure to that risk, and exposure is exactly what climate models can simulate and project. For example, a climate model can tell you, on average, how likely a severe drought is in an agricultural region at 1.5°C (the global average in 2025). Understanding this exposure to climate risk is the first step towards climate adaptation.
How to use climate models
Following a few guidelines can help you make informed decisions using climate model projections.
Use degrees of warming, not dates and years
Climate models simulate climate conditions based on how the composition of the atmosphere affects global average atmospheric temperature and, eventually, the physical impacts of climate change, such as extreme heat, drought, and precipitation.
Because climate models run based on these physical dynamics, the best way to use a climate model is by starting with a degree of warming, examining the simulated climate, and then considering when we may or may not reach that degree of warming. The year in which the earth may reach a certain degree of warming depends mostly on the rate and scale of human greenhouse gas emissions, which we can estimate, but not predict precisely.
Some climate maps project dates based on emissions scenarios—a specific, complex combination of human activities. Probable Futures maps only display degrees of warming, not precise dates.
Focus on temperature
Temperature is the easiest weather variable for scientists to model because the physics of heat are well-understood. Other kinds of weather, like precipitation and humidity, are harder to model because the physical conditions involved are more complex and involve more uncertainty. For example, rainfall needs moisture in the air and a catalyst to cause condensation and can vary over small areas.
More extreme and complex climate events, like hurricanes and typhoons, are challenging to model because scientists have limited observations to work from and they are the product of highly complex physics.
However, temperature is the driving force behind climate change and affects many of these weather events. For example, although scientists cannot predict the precise location of violent precipitation, they do know that higher temperatures make more erratic and violent precipitation patterns much more likely. That is useful information that we can use alongside historical data and climate model projections to understand trends about the future of those rare, harder-to-model events.
Consider feedbacks and tipping points
In addition to human greenhouse gas emissions, biotic feedbacks and tipping points within Earth’s systems can also increase global average temperature. Climate models may not account for this additional warming when simulating future climate conditions, so understanding when we might activate certain tipping points, like the melting of the Greenland Ice Sheet and the potential dieback of the Amazon rainforest, can provide more context to climate model projections.
Climate models are a useful tool for assessing climate risk. Explore our maps to visualize past, present, and future climate change around the world. With a click and a zoom, you can start using climate models to make climate-informed decisions in your own life and work.