These resources can strengthen your press coverage and deepen your audience’s understanding of extreme weather, tipping points and feedback loops, warming trajectories, and climate adaptation. We encourage you to use what you learn to guide your reporting, or cite our articles directly. You can also find specific climate literacy resources by searching by topic across our platform.
Probable Futures’ expert leadership is also available to provide print interviews, quotes, fact-checking, background briefings, and/or on-air commentary on climate topics. Visit our press toolkit to learn more.
Read
Extreme weather

- How warm air and water vapor create extreme weather
- What is a 1-in-100-year storm?
- What is wet-bulb temperature?
- What is the El Niño–Southern Oscillation (ENSO) cycle?
Tipping points and feedback loops
- What are climate feedback loops?
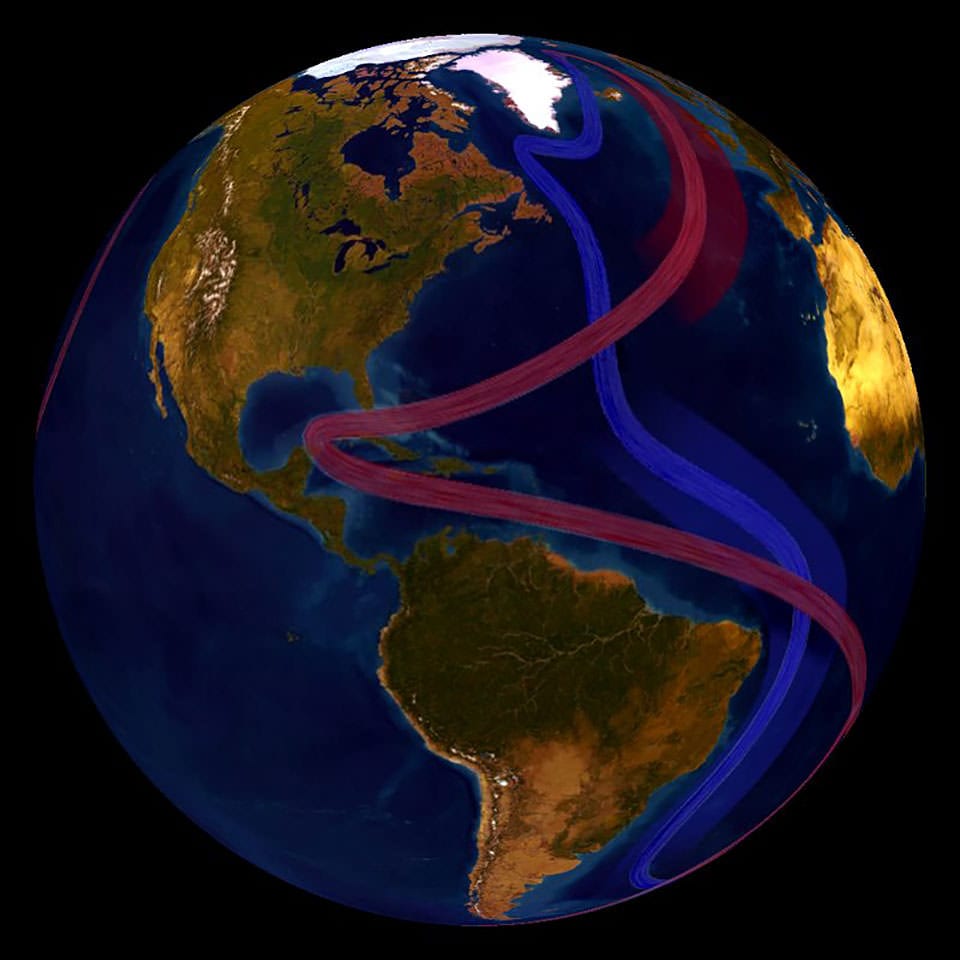
- A complete guide to the Atlantic Meridional Overturning Circulation (AMOC)
- What is albedo and how does it affect Earth’s climate?
Warming trajectories

- What is the Hothouse Earth trajectory?
- What is Earth’s energy imbalance and how is it changing?
- How do we measure climate change?
- Climate models: their strengths and how to use them
Climate adaptation

- What is climate adaptation?
- Managing climate risk through climate adaptation
- Climate resilience: what it is and how to build it
- How climate change impacts heat waves and ways to adapt
- Managing wildfire risk through climate adaptation
Systemic risk
- Solstice greetings: rearview mirror driving
- Director’s letter 2026: the long work ahead
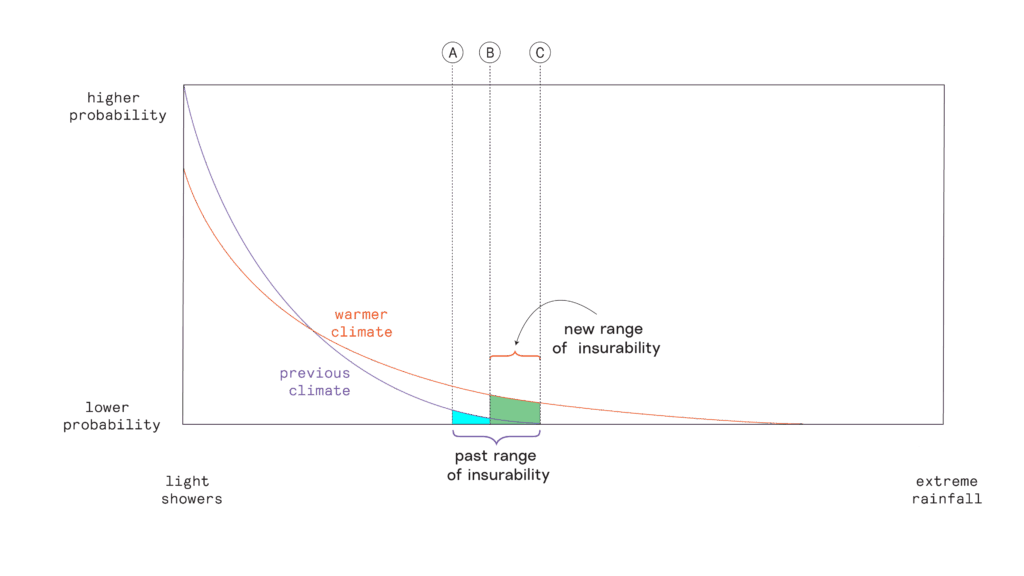
- Is the future insurable?
- What is the “right” way to communicate about climate change?
Climate foundations

Written in close collaboration with world-class scientists, our comprehensive climate handbook takes you from the climate stability of the past, through the changes we are experiencing today, and into our probable futures.
Explore
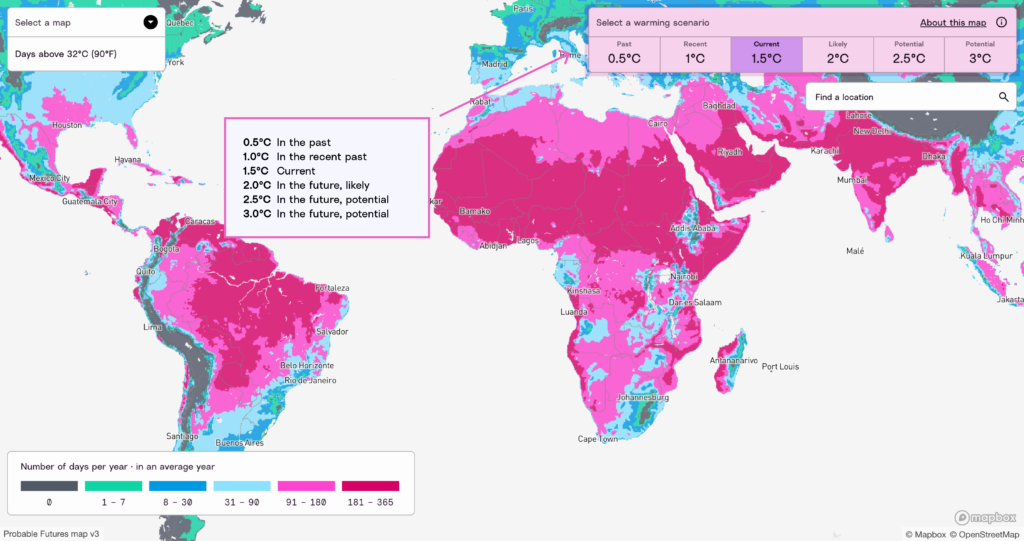
Probable Futures maps and data are freely available and licensed for widespread use. You can search by location and zoom in to 22km2 resolution for over 30 key climate risks at different warming scenarios. Then, download screenshots, map and comparison map embeds to include in your reporting.