Latest
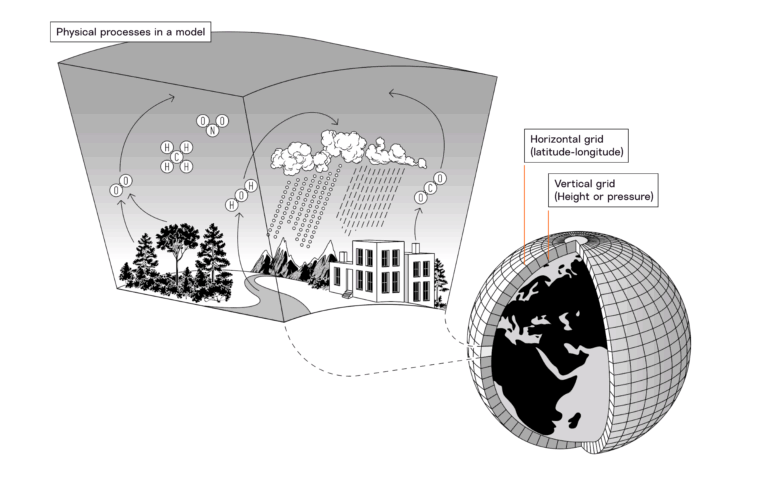
Climate models: their strengths and how to use them
Climate models can help us assess future risks
Latest
Climate models: their strengths and how to use them
Climate models can help us assess future risks
Collection: climate science
Recommended readings on the science behind our offerings

Mapping wildfire danger days in the Amazon
How to use the Probable Futures map of change in wildfire danger days

Mapping climate zones in Lebanon
How to use the Probable Futures map of climate zones
Mapping drought risk in Chiapas, Mexico
How to use the Probable Futures map of likelihood of year-plus drought
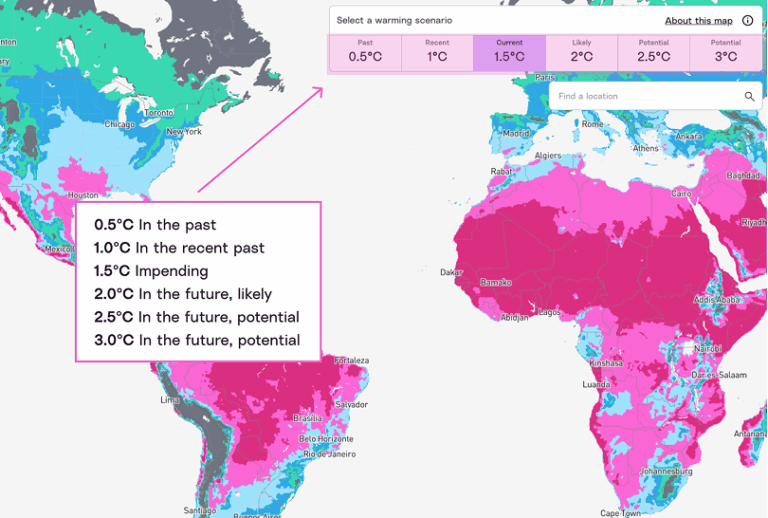
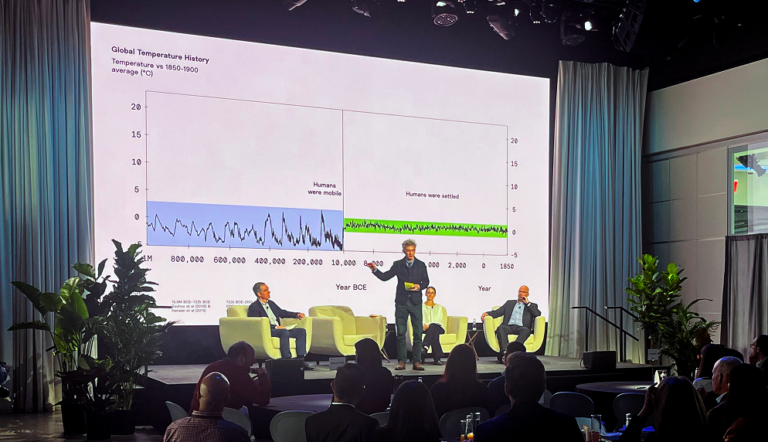
How do we measure climate change?
Degrees of warming tell us how much the earth has warmed since pre-industrial times

Mapping heat and humidity risk in Miami, Florida
How to use the Probable Futures map of days above 28°C wet-bulb
What is a 1-in-100-year storm?
A 1-in-100-year storm has a 1% chance of occurring in any given year
Profiles
“Climate change is impacting our world physically, socially, and economically, and young people are acutely aware of these implications for their generation.”
Designing a climate change course for the next generation
Dr. Meredith Galloway of Westlake Charter School helps students understand climate impacts around the world